METHODOLOGY MAPBIOMAS TRINATIONAL ATLANTIC FOREST – COLLECTION 3
Below you will find the main features, how the work is organized and an overview of the MapBiomas Trinational Atlantic Forest method for generating land cover and land use maps and transition/land use change maps between different years.
You can access the ATBD (Algorithm Theoretical Basis Document) with all the methodology description and algorithms by accessing the link below.
[DOWNLOAD COMPLETE METHODOLOGY – ATBD]
GENERAL CHARACTERISTICS
All annual land cover and land use maps of the MapBiomas Trinational Atlantic Forest are produced from the pixel-by-pixel classification of Landsat satellite images. The whole process is carried out on the Google Earth Engine platform which offers immense cloud processing capabilities.
HOW WE ARE ORGANIZED
For mapping, programmers, remote sensing specialists, and conservation and land use specialists are organized into teams for each country as they have leading institutions as part of their network.
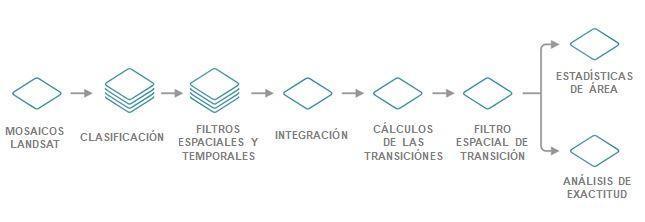
METHODOLOGY OVERVIEW
The diagram below illustrates the main stages in the process of generating the annual MapBiomas Trinational Atlantic Forest land cover and land use maps and transition maps.